| Target Load |
Actual Load |
ssj_ops |
| Target |
Actual |
| Calibration 1 |
|
|
3,048,450 |
| Calibration 2 |
|
|
3,220,160 |
| Calibration 3 |
|
|
3,225,958 |
| Calibration 4 |
|
|
3,228,458 |
| ssj_ops@calibrated=3,227,208 |
| 100% |
100.0% |
3,227,208 |
3,226,411 |
| 90% |
90.0% |
2,904,487 |
2,903,508 |
| 80% |
80.1% |
2,581,766 |
2,585,250 |
| 70% |
70.0% |
2,259,046 |
2,260,194 |
| 60% |
60.0% |
1,936,325 |
1,935,511 |
| 50% |
50.0% |
1,613,604 |
1,612,667 |
| 40% |
40.0% |
1,290,883 |
1,291,008 |
| 30% |
30.1% |
968,162 |
971,738 |
| 20% |
20.0% |
645,442 |
646,716 |
| 10% |
10.0% |
322,721 |
321,463 |
| Active Idle |
|
0 |
0 |
| Hardware |
| Hardware Vendor: |
Fujitsu |
| Model: |
FUJITSU Server PRIMERGY CX2550 M1 |
| Form Factor: |
Blade |
| CPU Name: |
Intel Xeon E5-2699 v3 |
| CPU Characteristics: |
18-Core, 2.30GHz, 45MB L3 Cache |
| CPU Frequency (MHz): |
2300 |
| CPU(s) Enabled: |
36 cores, 2 chips, 18 cores/chip |
| Hardware Threads: |
72 (2 / core) |
| CPU(s) Orderable: |
1,2 chips |
| Primary Cache: |
32 KB I + 32 KB D on chip per core |
| Secondary Cache: |
256 KB I+D on chip per core |
| Tertiary Cache: |
45 MB I+D on chip per chip |
| Other Cache: |
None |
| Memory Amount (GB): |
64 |
| # and size of DIMM: |
8 x 8192 MB |
| Memory Details: |
8 GB DDR4, registered, ECC, 2133 MHz, PC4-2133R, DIMM, 2Rx8; slots 1A, 1B, 1C, 1D, 1E, 1F, 1G, 1H populated |
| Power Supply Quantity and Rating (W): |
None |
| Power Supply Details: |
N/A |
| Disk Drive: |
1 x SSD SATA 6G 64GB DOM N H-P, S26361-F5523-E64 |
| Disk Controller: |
Integrated SATA Controller |
| # and type of Network Interface Cards (NICs) Installed: |
2 x Intel I350 Gigabit Network Connection (onboard) |
| NICs Enabled in Firmware / OS / Connected: |
1/1/1 |
| Network Speed (Mbit): |
1000 |
| Keyboard: |
None |
| Mouse: |
None |
| Monitor: |
None |
| Optical Drives: |
No |
| Other Hardware: |
None |
| Software |
| Power Management: |
Enabled ("Fujitsu Enhanced Power Settings" power plan) |
| Operating System (OS): |
Microsoft Windows Server 2008 R2 Enterprise SP1 |
| OS Version: |
Version 6.1.7601 Service Pack 1 Build 7601 |
| Filesystem: |
NTFS |
| JVM Vendor: |
IBM Corporation |
| JVM Version: |
IBM J9 VM (build 2.6, JRE 1.7.0 Windows Server 2008 R2 amd64-64 20120322_106209 (JIT enabled, AOT enabled) |
| JVM Command-line Options: |
-Xmn825m -Xms975m -Xmx975m -Xaggressive -Xcompressedrefs -Xgcpolicy:gencon -XlockReservation -Xnoloa -XtlhPrefetch -Xlp -Xconcurrentlevel0 -Xthr:minimizeusercpu -Xgcthreads2 (-Xgcthreads1 for JVM5 and JVM23) |
| JVM Affinity: |
start /NODE [0,1,2,3] /AFFINITY [0x3,0xC,0x30,0xC0,0x300,0xC00,0x3000,0xC000,0x30000] |
| JVM Instances: |
36 |
| JVM Initial Heap (MB): |
975 |
| JVM Maximum Heap (MB): |
975 |
| JVM Address Bits: |
64 |
| Boot Firmware Version: |
R1.7.0 |
| Management Firmware Version: |
7.64F |
| Workload Version: |
SSJ 1.2.10 |
| Director Location: |
Controller |
| Other Software: |
IBM WebSphere Application Server V8.5.0.0, Microsoft Hotfix for Windows (KB2510206) |
| JVM Instance |
ssj_ops@100% |
| Node_03.001 |
90,269 |
| Node_03.002 |
88,600 |
| Node_03.003 |
89,460 |
| Node_03.004 |
89,469 |
| Node_03.005 |
86,900 |
| Node_03.006 |
90,685 |
| Node_03.007 |
91,116 |
| Node_03.008 |
91,237 |
| Node_03.009 |
91,194 |
| Node_03.010 |
87,669 |
| Node_03.011 |
87,075 |
| Node_03.012 |
90,953 |
| Node_03.013 |
89,488 |
| Node_03.014 |
90,084 |
| Node_03.015 |
88,274 |
| Node_03.016 |
89,609 |
| Node_03.017 |
90,209 |
| Node_03.018 |
90,420 |
| Node_03.019 |
88,836 |
| Node_03.020 |
89,068 |
| Node_03.021 |
89,435 |
| Node_03.022 |
90,186 |
| Node_03.023 |
85,834 |
| Node_03.024 |
90,744 |
| Node_03.025 |
90,262 |
| Node_03.026 |
90,453 |
| Node_03.027 |
90,888 |
| Node_03.028 |
88,428 |
| Node_03.029 |
88,513 |
| Node_03.030 |
89,474 |
| Node_03.031 |
90,594 |
| Node_03.032 |
90,372 |
| Node_03.033 |
89,521 |
| Node_03.034 |
89,683 |
| Node_03.035 |
90,756 |
| Node_03.036 |
90,655 |
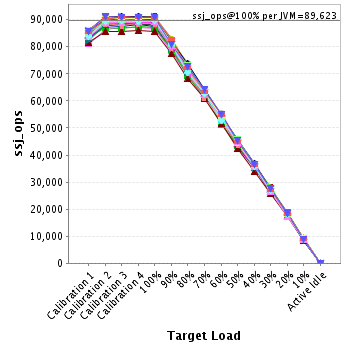
| ssj_ops@100% |
3,226,411 |
| ssj_ops@100% per JVM |
89,623 |
JVM 'Node_03.001' Scores:
| Target Load |
Actual Load |
ssj_ops |
| Target |
Actual |
| Calibration 1 |
|
|
85,250 |
| Calibration 2 |
|
|
90,216 |
| Calibration 3 |
|
|
90,536 |
| Calibration 4 |
|
|
90,055 |
| ssj_ops@calibrated=90,296 |
| 100% |
100.0% |
90,296 |
90,269 |
| 90% |
90.1% |
81,266 |
81,394 |
| 80% |
79.7% |
72,237 |
71,957 |
| 70% |
71.2% |
63,207 |
64,293 |
| 60% |
60.5% |
54,177 |
54,624 |
| 50% |
50.4% |
45,148 |
45,540 |
| 40% |
39.6% |
36,118 |
35,739 |
| 30% |
30.4% |
27,089 |
27,491 |
| 20% |
20.1% |
18,059 |
18,157 |
| 10% |
9.7% |
9,030 |
8,787 |
| Active Idle |
|
0 |
0 |
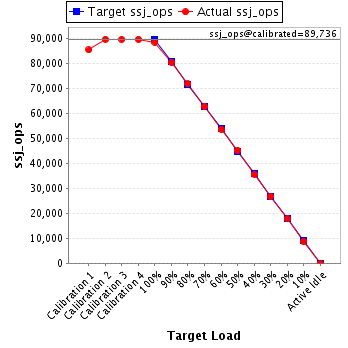
JVM 'Node_03.002' Scores:
| Target Load |
Actual Load |
ssj_ops |
| Target |
Actual |
| Calibration 1 |
|
|
85,482 |
| Calibration 2 |
|
|
89,808 |
| Calibration 3 |
|
|
89,722 |
| Calibration 4 |
|
|
89,750 |
| ssj_ops@calibrated=89,736 |
| 100% |
98.7% |
89,736 |
88,600 |
| 90% |
89.8% |
80,762 |
80,579 |
| 80% |
80.1% |
71,789 |
71,887 |
| 70% |
70.0% |
62,815 |
62,812 |
| 60% |
59.8% |
53,842 |
53,632 |
| 50% |
50.5% |
44,868 |
45,313 |
| 40% |
39.7% |
35,894 |
35,636 |
| 30% |
29.8% |
26,921 |
26,727 |
| 20% |
19.8% |
17,947 |
17,795 |
| 10% |
9.8% |
8,974 |
8,833 |
| Active Idle |
|
0 |
0 |
JVM 'Node_03.003' Scores:
| Target Load |
Actual Load |
ssj_ops |
| Target |
Actual |
| Calibration 1 |
|
|
84,260 |
| Calibration 2 |
|
|
88,956 |
| Calibration 3 |
|
|
89,740 |
| Calibration 4 |
|
|
89,351 |
| ssj_ops@calibrated=89,545 |
| 100% |
99.9% |
89,545 |
89,460 |
| 90% |
89.8% |
80,591 |
80,443 |
| 80% |
80.6% |
71,636 |
72,196 |
| 70% |
69.9% |
62,682 |
62,569 |
| 60% |
59.8% |
53,727 |
53,518 |
| 50% |
49.1% |
44,773 |
43,961 |
| 40% |
40.4% |
35,818 |
36,182 |
| 30% |
30.3% |
26,864 |
27,096 |
| 20% |
19.9% |
17,909 |
17,791 |
| 10% |
10.1% |
8,955 |
9,021 |
| Active Idle |
|
0 |
0 |
JVM 'Node_03.004' Scores:
| Target Load |
Actual Load |
ssj_ops |
| Target |
Actual |
| Calibration 1 |
|
|
85,586 |
| Calibration 2 |
|
|
89,510 |
| Calibration 3 |
|
|
89,500 |
| Calibration 4 |
|
|
89,557 |
| ssj_ops@calibrated=89,528 |
| 100% |
99.9% |
89,528 |
89,469 |
| 90% |
90.4% |
80,576 |
80,895 |
| 80% |
80.2% |
71,623 |
71,788 |
| 70% |
70.2% |
62,670 |
62,871 |
| 60% |
60.1% |
53,717 |
53,787 |
| 50% |
49.7% |
44,764 |
44,504 |
| 40% |
40.6% |
35,811 |
36,376 |
| 30% |
29.7% |
26,859 |
26,592 |
| 20% |
20.4% |
17,906 |
18,243 |
| 10% |
10.5% |
8,953 |
9,420 |
| Active Idle |
|
0 |
0 |
JVM 'Node_03.005' Scores:
| Target Load |
Actual Load |
ssj_ops |
| Target |
Actual |
| Calibration 1 |
|
|
80,665 |
| Calibration 2 |
|
|
86,240 |
| Calibration 3 |
|
|
86,960 |
| Calibration 4 |
|
|
86,999 |
| ssj_ops@calibrated=86,979 |
| 100% |
99.9% |
86,979 |
86,900 |
| 90% |
89.8% |
78,281 |
78,081 |
| 80% |
79.6% |
69,583 |
69,207 |
| 70% |
70.0% |
60,885 |
60,849 |
| 60% |
59.7% |
52,188 |
51,951 |
| 50% |
49.2% |
43,490 |
42,822 |
| 40% |
40.4% |
34,792 |
35,132 |
| 30% |
30.1% |
26,094 |
26,161 |
| 20% |
20.2% |
17,396 |
17,582 |
| 10% |
10.1% |
8,698 |
8,745 |
| Active Idle |
|
0 |
0 |
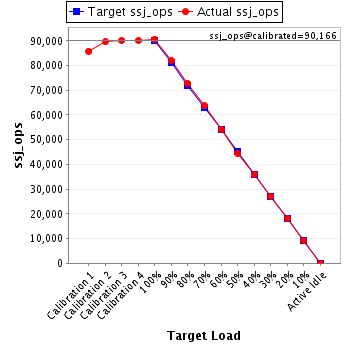
JVM 'Node_03.006' Scores:
| Target Load |
Actual Load |
ssj_ops |
| Target |
Actual |
| Calibration 1 |
|
|
85,770 |
| Calibration 2 |
|
|
89,633 |
| Calibration 3 |
|
|
90,214 |
| Calibration 4 |
|
|
90,119 |
| ssj_ops@calibrated=90,166 |
| 100% |
100.6% |
90,166 |
90,685 |
| 90% |
90.9% |
81,149 |
81,959 |
| 80% |
80.7% |
72,133 |
72,751 |
| 70% |
70.6% |
63,116 |
63,653 |
| 60% |
60.1% |
54,100 |
54,232 |
| 50% |
49.5% |
45,083 |
44,605 |
| 40% |
39.8% |
36,066 |
35,875 |
| 30% |
30.1% |
27,050 |
27,178 |
| 20% |
20.1% |
18,033 |
18,120 |
| 10% |
10.1% |
9,017 |
9,112 |
| Active Idle |
|
0 |
0 |
JVM 'Node_03.007' Scores:
| Target Load |
Actual Load |
ssj_ops |
| Target |
Actual |
| Calibration 1 |
|
|
85,557 |
| Calibration 2 |
|
|
90,349 |
| Calibration 3 |
|
|
91,106 |
| Calibration 4 |
|
|
90,730 |
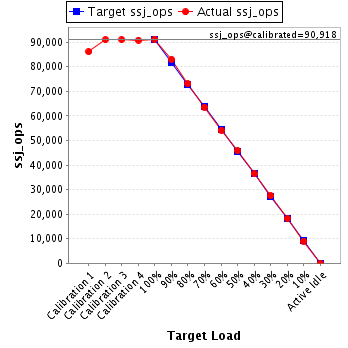
| ssj_ops@calibrated=90,918 |
| 100% |
100.2% |
90,918 |
91,116 |
| 90% |
88.4% |
81,826 |
80,344 |
| 80% |
80.0% |
72,735 |
72,752 |
| 70% |
68.3% |
63,643 |
62,085 |
| 60% |
60.2% |
54,551 |
54,778 |
| 50% |
49.6% |
45,459 |
45,105 |
| 40% |
40.1% |
36,367 |
36,448 |
| 30% |
30.4% |
27,275 |
27,648 |
| 20% |
19.9% |
18,184 |
18,133 |
| 10% |
10.2% |
9,092 |
9,249 |
| Active Idle |
|
0 |
0 |
JVM 'Node_03.008' Scores:
| Target Load |
Actual Load |
ssj_ops |
| Target |
Actual |
| Calibration 1 |
|
|
86,115 |
| Calibration 2 |
|
|
90,945 |
| Calibration 3 |
|
|
91,010 |
| Calibration 4 |
|
|
90,826 |
| ssj_ops@calibrated=90,918 |
| 100% |
100.4% |
90,918 |
91,237 |
| 90% |
91.3% |
81,826 |
83,023 |
| 80% |
80.4% |
72,734 |
73,108 |
| 70% |
70.0% |
63,642 |
63,597 |
| 60% |
59.5% |
54,551 |
54,097 |
| 50% |
50.3% |
45,459 |
45,754 |
| 40% |
40.1% |
36,367 |
36,445 |
| 30% |
30.2% |
27,275 |
27,474 |
| 20% |
20.1% |
18,184 |
18,230 |
| 10% |
10.0% |
9,092 |
9,054 |
| Active Idle |
|
0 |
0 |
JVM 'Node_03.009' Scores:
| Target Load |
Actual Load |
ssj_ops |
| Target |
Actual |
| Calibration 1 |
|
|
86,074 |
| Calibration 2 |
|
|
91,145 |
| Calibration 3 |
|
|
90,917 |
| Calibration 4 |
|
|
90,948 |
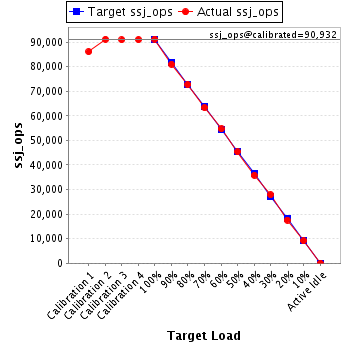
| ssj_ops@calibrated=90,932 |
| 100% |
100.3% |
90,932 |
91,194 |
| 90% |
89.1% |
81,839 |
81,029 |
| 80% |
79.9% |
72,746 |
72,699 |
| 70% |
69.6% |
63,653 |
63,305 |
| 60% |
60.1% |
54,559 |
54,673 |
| 50% |
49.8% |
45,466 |
45,278 |
| 40% |
39.4% |
36,373 |
35,830 |
| 30% |
30.6% |
27,280 |
27,842 |
| 20% |
19.4% |
18,186 |
17,595 |
| 10% |
10.0% |
9,093 |
9,096 |
| Active Idle |
|
0 |
0 |
JVM 'Node_03.010' Scores:
| Target Load |
Actual Load |
ssj_ops |
| Target |
Actual |
| Calibration 1 |
|
|
82,885 |
| Calibration 2 |
|
|
87,734 |
| Calibration 3 |
|
|
87,615 |
| Calibration 4 |
|
|
88,164 |
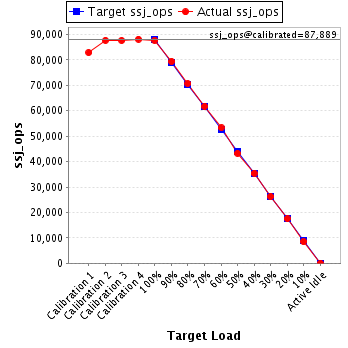
| ssj_ops@calibrated=87,889 |
| 100% |
99.7% |
87,889 |
87,669 |
| 90% |
90.4% |
79,100 |
79,411 |
| 80% |
80.5% |
70,311 |
70,744 |
| 70% |
70.3% |
61,523 |
61,768 |
| 60% |
60.7% |
52,734 |
53,369 |
| 50% |
49.2% |
43,945 |
43,273 |
| 40% |
40.2% |
35,156 |
35,374 |
| 30% |
29.8% |
26,367 |
26,218 |
| 20% |
19.9% |
17,578 |
17,523 |
| 10% |
9.6% |
8,789 |
8,474 |
| Active Idle |
|
0 |
0 |
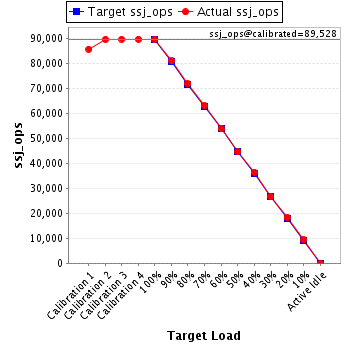
JVM 'Node_03.011' Scores:
| Target Load |
Actual Load |
ssj_ops |
| Target |
Actual |
| Calibration 1 |
|
|
83,543 |
| Calibration 2 |
|
|
87,252 |
| Calibration 3 |
|
|
86,656 |
| Calibration 4 |
|
|
87,585 |
| ssj_ops@calibrated=87,120 |
| 100% |
99.9% |
87,120 |
87,075 |
| 90% |
90.5% |
78,408 |
78,869 |
| 80% |
79.9% |
69,696 |
69,566 |
| 70% |
70.3% |
60,984 |
61,287 |
| 60% |
59.0% |
52,272 |
51,366 |
| 50% |
50.0% |
43,560 |
43,579 |
| 40% |
40.8% |
34,848 |
35,507 |
| 30% |
30.6% |
26,136 |
26,683 |
| 20% |
20.2% |
17,424 |
17,588 |
| 10% |
10.0% |
8,712 |
8,733 |
| Active Idle |
|
0 |
0 |
JVM 'Node_03.012' Scores:
| Target Load |
Actual Load |
ssj_ops |
| Target |
Actual |
| Calibration 1 |
|
|
86,071 |
| Calibration 2 |
|
|
90,789 |
| Calibration 3 |
|
|
91,080 |
| Calibration 4 |
|
|
91,202 |
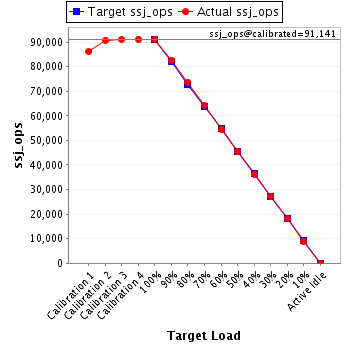
| ssj_ops@calibrated=91,141 |
| 100% |
99.8% |
91,141 |
90,953 |
| 90% |
90.7% |
82,027 |
82,694 |
| 80% |
80.8% |
72,913 |
73,647 |
| 70% |
70.4% |
63,799 |
64,198 |
| 60% |
59.8% |
54,685 |
54,543 |
| 50% |
50.0% |
45,571 |
45,613 |
| 40% |
39.8% |
36,456 |
36,305 |
| 30% |
29.9% |
27,342 |
27,229 |
| 20% |
19.9% |
18,228 |
18,099 |
| 10% |
9.9% |
9,114 |
9,033 |
| Active Idle |
|
0 |
0 |
JVM 'Node_03.013' Scores:
| Target Load |
Actual Load |
ssj_ops |
| Target |
Actual |
| Calibration 1 |
|
|
84,620 |
| Calibration 2 |
|
|
89,297 |
| Calibration 3 |
|
|
89,104 |
| Calibration 4 |
|
|
89,260 |
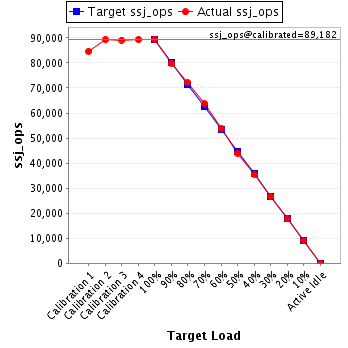
| ssj_ops@calibrated=89,182 |
| 100% |
100.3% |
89,182 |
89,488 |
| 90% |
89.6% |
80,264 |
79,921 |
| 80% |
80.8% |
71,345 |
72,070 |
| 70% |
71.4% |
62,427 |
63,636 |
| 60% |
60.4% |
53,509 |
53,827 |
| 50% |
49.4% |
44,591 |
44,014 |
| 40% |
39.8% |
35,673 |
35,518 |
| 30% |
29.7% |
26,755 |
26,509 |
| 20% |
19.8% |
17,836 |
17,691 |
| 10% |
10.1% |
8,918 |
8,996 |
| Active Idle |
|
0 |
0 |
JVM 'Node_03.014' Scores:
| Target Load |
Actual Load |
ssj_ops |
| Target |
Actual |
| Calibration 1 |
|
|
85,475 |
| Calibration 2 |
|
|
89,906 |
| Calibration 3 |
|
|
89,655 |
| Calibration 4 |
|
|
89,994 |
| ssj_ops@calibrated=89,824 |
| 100% |
100.3% |
89,824 |
90,084 |
| 90% |
89.6% |
80,842 |
80,443 |
| 80% |
79.9% |
71,860 |
71,753 |
| 70% |
69.7% |
62,877 |
62,622 |
| 60% |
61.0% |
53,895 |
54,756 |
| 50% |
49.6% |
44,912 |
44,587 |
| 40% |
39.3% |
35,930 |
35,289 |
| 30% |
30.2% |
26,947 |
27,171 |
| 20% |
20.0% |
17,965 |
17,962 |
| 10% |
9.7% |
8,982 |
8,716 |
| Active Idle |
|
0 |
0 |
JVM 'Node_03.015' Scores:
| Target Load |
Actual Load |
ssj_ops |
| Target |
Actual |
| Calibration 1 |
|
|
83,555 |
| Calibration 2 |
|
|
87,736 |
| Calibration 3 |
|
|
88,293 |
| Calibration 4 |
|
|
88,262 |
| ssj_ops@calibrated=88,278 |
| 100% |
100.0% |
88,278 |
88,274 |
| 90% |
90.4% |
79,450 |
79,820 |
| 80% |
80.1% |
70,622 |
70,693 |
| 70% |
71.0% |
61,794 |
62,673 |
| 60% |
60.6% |
52,967 |
53,458 |
| 50% |
50.6% |
44,139 |
44,708 |
| 40% |
40.3% |
35,311 |
35,575 |
| 30% |
29.9% |
26,483 |
26,404 |
| 20% |
19.8% |
17,656 |
17,479 |
| 10% |
9.9% |
8,828 |
8,766 |
| Active Idle |
|
0 |
0 |
JVM 'Node_03.016' Scores:
| Target Load |
Actual Load |
ssj_ops |
| Target |
Actual |
| Calibration 1 |
|
|
84,284 |
| Calibration 2 |
|
|
88,625 |
| Calibration 3 |
|
|
88,993 |
| Calibration 4 |
|
|
89,736 |
| ssj_ops@calibrated=89,364 |
| 100% |
100.3% |
89,364 |
89,609 |
| 90% |
90.6% |
80,428 |
80,934 |
| 80% |
80.3% |
71,492 |
71,745 |
| 70% |
70.0% |
62,555 |
62,561 |
| 60% |
59.8% |
53,619 |
53,449 |
| 50% |
50.6% |
44,682 |
45,222 |
| 40% |
40.0% |
35,746 |
35,714 |
| 30% |
30.4% |
26,809 |
27,166 |
| 20% |
20.3% |
17,873 |
18,154 |
| 10% |
9.8% |
8,936 |
8,775 |
| Active Idle |
|
0 |
0 |
JVM 'Node_03.017' Scores:
| Target Load |
Actual Load |
ssj_ops |
| Target |
Actual |
| Calibration 1 |
|
|
84,713 |
| Calibration 2 |
|
|
90,232 |
| Calibration 3 |
|
|
90,158 |
| Calibration 4 |
|
|
89,856 |
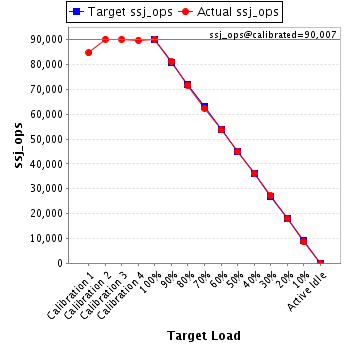
| ssj_ops@calibrated=90,007 |
| 100% |
100.2% |
90,007 |
90,209 |
| 90% |
90.1% |
81,006 |
81,053 |
| 80% |
79.7% |
72,006 |
71,716 |
| 70% |
69.3% |
63,005 |
62,419 |
| 60% |
59.6% |
54,004 |
53,669 |
| 50% |
50.1% |
45,004 |
45,049 |
| 40% |
40.1% |
36,003 |
36,105 |
| 30% |
30.2% |
27,002 |
27,194 |
| 20% |
20.0% |
18,001 |
17,962 |
| 10% |
9.5% |
9,001 |
8,591 |
| Active Idle |
|
0 |
0 |
JVM 'Node_03.018' Scores:
| Target Load |
Actual Load |
ssj_ops |
| Target |
Actual |
| Calibration 1 |
|
|
84,819 |
| Calibration 2 |
|
|
89,947 |
| Calibration 3 |
|
|
90,908 |
| Calibration 4 |
|
|
90,644 |
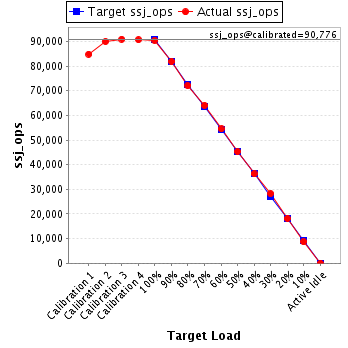
| ssj_ops@calibrated=90,776 |
| 100% |
99.6% |
90,776 |
90,420 |
| 90% |
90.2% |
81,698 |
81,850 |
| 80% |
79.4% |
72,621 |
72,076 |
| 70% |
70.5% |
63,543 |
64,041 |
| 60% |
60.1% |
54,465 |
54,511 |
| 50% |
49.9% |
45,388 |
45,261 |
| 40% |
39.9% |
36,310 |
36,255 |
| 30% |
31.1% |
27,233 |
28,203 |
| 20% |
20.0% |
18,155 |
18,177 |
| 10% |
9.5% |
9,078 |
8,662 |
| Active Idle |
|
0 |
0 |
JVM 'Node_03.019' Scores:
| Target Load |
Actual Load |
ssj_ops |
| Target |
Actual |
| Calibration 1 |
|
|
84,659 |
| Calibration 2 |
|
|
89,122 |
| Calibration 3 |
|
|
89,302 |
| Calibration 4 |
|
|
88,814 |
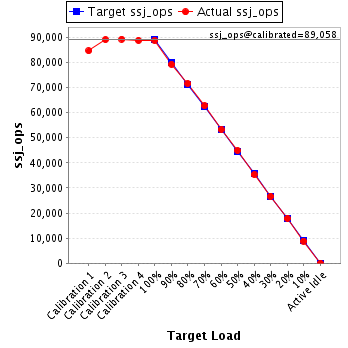
| ssj_ops@calibrated=89,058 |
| 100% |
99.8% |
89,058 |
88,836 |
| 90% |
89.0% |
80,152 |
79,294 |
| 80% |
80.4% |
71,246 |
71,615 |
| 70% |
70.4% |
62,341 |
62,719 |
| 60% |
59.8% |
53,435 |
53,296 |
| 50% |
50.4% |
44,529 |
44,911 |
| 40% |
39.7% |
35,623 |
35,324 |
| 30% |
30.0% |
26,717 |
26,696 |
| 20% |
20.1% |
17,812 |
17,866 |
| 10% |
9.9% |
8,906 |
8,854 |
| Active Idle |
|
0 |
0 |
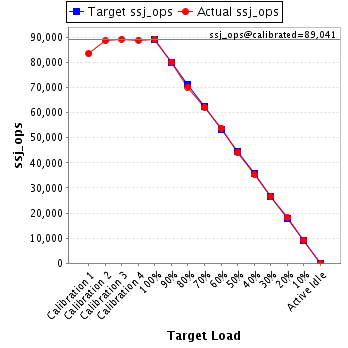
JVM 'Node_03.020' Scores:
| Target Load |
Actual Load |
ssj_ops |
| Target |
Actual |
| Calibration 1 |
|
|
83,462 |
| Calibration 2 |
|
|
88,524 |
| Calibration 3 |
|
|
89,253 |
| Calibration 4 |
|
|
88,829 |
| ssj_ops@calibrated=89,041 |
| 100% |
100.0% |
89,041 |
89,068 |
| 90% |
90.0% |
80,137 |
80,119 |
| 80% |
78.8% |
71,233 |
70,138 |
| 70% |
69.9% |
62,329 |
62,213 |
| 60% |
60.3% |
53,425 |
53,711 |
| 50% |
49.5% |
44,521 |
44,084 |
| 40% |
39.7% |
35,616 |
35,387 |
| 30% |
29.8% |
26,712 |
26,509 |
| 20% |
20.3% |
17,808 |
18,078 |
| 10% |
10.3% |
8,904 |
9,157 |
| Active Idle |
|
0 |
0 |
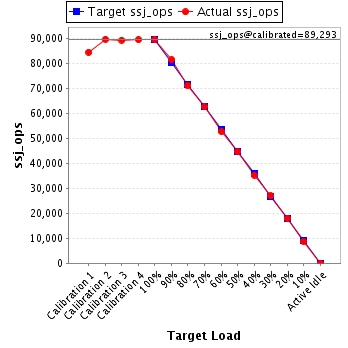
JVM 'Node_03.021' Scores:
| Target Load |
Actual Load |
ssj_ops |
| Target |
Actual |
| Calibration 1 |
|
|
84,364 |
| Calibration 2 |
|
|
89,618 |
| Calibration 3 |
|
|
89,213 |
| Calibration 4 |
|
|
89,374 |
| ssj_ops@calibrated=89,293 |
| 100% |
100.2% |
89,293 |
89,435 |
| 90% |
91.1% |
80,364 |
81,332 |
| 80% |
79.6% |
71,435 |
71,101 |
| 70% |
70.0% |
62,505 |
62,494 |
| 60% |
59.0% |
53,576 |
52,690 |
| 50% |
49.9% |
44,647 |
44,538 |
| 40% |
39.5% |
35,717 |
35,237 |
| 30% |
30.1% |
26,788 |
26,909 |
| 20% |
20.1% |
17,859 |
17,968 |
| 10% |
9.8% |
8,929 |
8,750 |
| Active Idle |
|
0 |
0 |
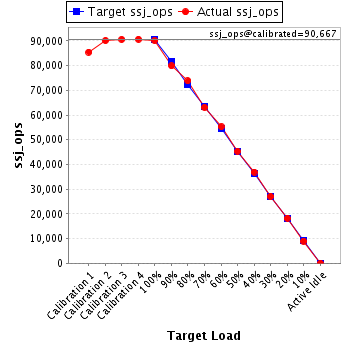
JVM 'Node_03.022' Scores:
| Target Load |
Actual Load |
ssj_ops |
| Target |
Actual |
| Calibration 1 |
|
|
85,489 |
| Calibration 2 |
|
|
90,160 |
| Calibration 3 |
|
|
90,628 |
| Calibration 4 |
|
|
90,707 |
| ssj_ops@calibrated=90,667 |
| 100% |
99.5% |
90,667 |
90,186 |
| 90% |
88.1% |
81,600 |
79,855 |
| 80% |
81.4% |
72,534 |
73,816 |
| 70% |
69.6% |
63,467 |
63,126 |
| 60% |
61.0% |
54,400 |
55,323 |
| 50% |
50.1% |
45,334 |
45,407 |
| 40% |
40.7% |
36,267 |
36,935 |
| 30% |
29.8% |
27,200 |
27,016 |
| 20% |
20.1% |
18,133 |
18,261 |
| 10% |
9.9% |
9,067 |
8,996 |
| Active Idle |
|
0 |
0 |
JVM 'Node_03.023' Scores:
| Target Load |
Actual Load |
ssj_ops |
| Target |
Actual |
| Calibration 1 |
|
|
81,451 |
| Calibration 2 |
|
|
85,797 |
| Calibration 3 |
|
|
85,744 |
| Calibration 4 |
|
|
85,916 |
| ssj_ops@calibrated=85,830 |
| 100% |
100.0% |
85,830 |
85,834 |
| 90% |
90.2% |
77,247 |
77,410 |
| 80% |
79.6% |
68,664 |
68,296 |
| 70% |
71.0% |
60,081 |
60,946 |
| 60% |
60.1% |
51,498 |
51,590 |
| 50% |
49.3% |
42,915 |
42,348 |
| 40% |
39.5% |
34,332 |
33,866 |
| 30% |
30.0% |
25,749 |
25,744 |
| 20% |
20.3% |
17,166 |
17,384 |
| 10% |
10.0% |
8,583 |
8,583 |
| Active Idle |
|
0 |
0 |
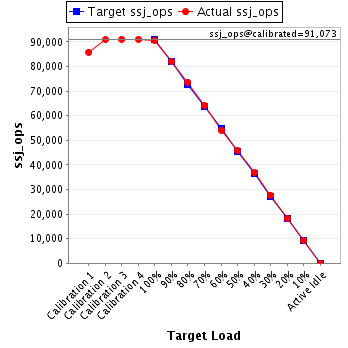
JVM 'Node_03.024' Scores:
| Target Load |
Actual Load |
ssj_ops |
| Target |
Actual |
| Calibration 1 |
|
|
85,842 |
| Calibration 2 |
|
|
90,854 |
| Calibration 3 |
|
|
91,049 |
| Calibration 4 |
|
|
91,097 |
| ssj_ops@calibrated=91,073 |
| 100% |
99.6% |
91,073 |
90,744 |
| 90% |
90.1% |
81,966 |
82,069 |
| 80% |
80.9% |
72,859 |
73,665 |
| 70% |
70.5% |
63,751 |
64,186 |
| 60% |
59.4% |
54,644 |
54,101 |
| 50% |
50.2% |
45,537 |
45,710 |
| 40% |
40.4% |
36,429 |
36,749 |
| 30% |
30.4% |
27,322 |
27,692 |
| 20% |
20.1% |
18,215 |
18,295 |
| 10% |
10.2% |
9,107 |
9,308 |
| Active Idle |
|
0 |
0 |
JVM 'Node_03.025' Scores:
| Target Load |
Actual Load |
ssj_ops |
| Target |
Actual |
| Calibration 1 |
|
|
84,639 |
| Calibration 2 |
|
|
90,560 |
| Calibration 3 |
|
|
90,192 |
| Calibration 4 |
|
|
90,096 |
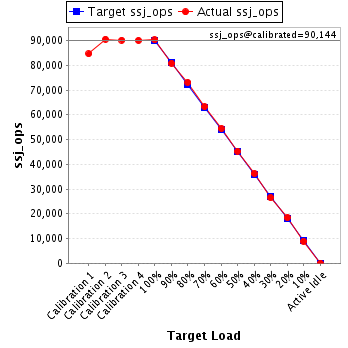
| ssj_ops@calibrated=90,144 |
| 100% |
100.1% |
90,144 |
90,262 |
| 90% |
89.7% |
81,130 |
80,840 |
| 80% |
81.1% |
72,115 |
73,098 |
| 70% |
70.1% |
63,101 |
63,224 |
| 60% |
60.4% |
54,086 |
54,457 |
| 50% |
50.3% |
45,072 |
45,338 |
| 40% |
40.3% |
36,058 |
36,297 |
| 30% |
29.4% |
27,043 |
26,504 |
| 20% |
20.4% |
18,029 |
18,425 |
| 10% |
9.9% |
9,014 |
8,886 |
| Active Idle |
|
0 |
0 |
JVM 'Node_03.026' Scores:
| Target Load |
Actual Load |
ssj_ops |
| Target |
Actual |
| Calibration 1 |
|
|
85,825 |
| Calibration 2 |
|
|
90,848 |
| Calibration 3 |
|
|
90,557 |
| Calibration 4 |
|
|
90,823 |
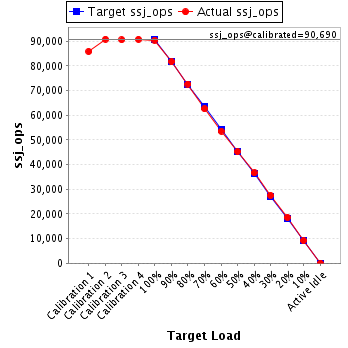
| ssj_ops@calibrated=90,690 |
| 100% |
99.7% |
90,690 |
90,453 |
| 90% |
90.1% |
81,621 |
81,688 |
| 80% |
80.1% |
72,552 |
72,651 |
| 70% |
69.0% |
63,483 |
62,575 |
| 60% |
59.1% |
54,414 |
53,556 |
| 50% |
49.8% |
45,345 |
45,189 |
| 40% |
40.4% |
36,276 |
36,649 |
| 30% |
30.3% |
27,207 |
27,515 |
| 20% |
20.5% |
18,138 |
18,602 |
| 10% |
10.1% |
9,069 |
9,175 |
| Active Idle |
|
0 |
0 |
JVM 'Node_03.027' Scores:
| Target Load |
Actual Load |
ssj_ops |
| Target |
Actual |
| Calibration 1 |
|
|
86,218 |
| Calibration 2 |
|
|
89,898 |
| Calibration 3 |
|
|
90,259 |
| Calibration 4 |
|
|
90,940 |
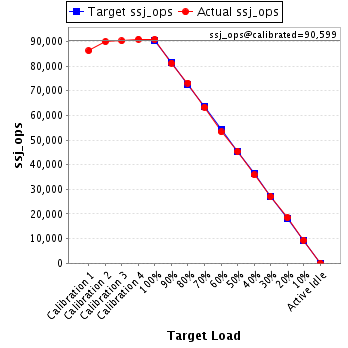
| ssj_ops@calibrated=90,599 |
| 100% |
100.3% |
90,599 |
90,888 |
| 90% |
89.7% |
81,539 |
81,239 |
| 80% |
80.7% |
72,479 |
73,128 |
| 70% |
69.9% |
63,420 |
63,320 |
| 60% |
58.8% |
54,360 |
53,313 |
| 50% |
50.0% |
45,300 |
45,335 |
| 40% |
39.6% |
36,240 |
35,886 |
| 30% |
29.8% |
27,180 |
27,024 |
| 20% |
20.5% |
18,120 |
18,528 |
| 10% |
10.3% |
9,060 |
9,316 |
| Active Idle |
|
0 |
0 |
JVM 'Node_03.028' Scores:
| Target Load |
Actual Load |
ssj_ops |
| Target |
Actual |
| Calibration 1 |
|
|
82,420 |
| Calibration 2 |
|
|
88,370 |
| Calibration 3 |
|
|
88,611 |
| Calibration 4 |
|
|
88,665 |
| ssj_ops@calibrated=88,638 |
| 100% |
99.8% |
88,638 |
88,428 |
| 90% |
89.5% |
79,774 |
79,311 |
| 80% |
79.7% |
70,911 |
70,613 |
| 70% |
69.4% |
62,047 |
61,474 |
| 60% |
60.6% |
53,183 |
53,680 |
| 50% |
51.1% |
44,319 |
45,312 |
| 40% |
39.7% |
35,455 |
35,215 |
| 30% |
29.9% |
26,591 |
26,489 |
| 20% |
19.7% |
17,728 |
17,499 |
| 10% |
10.1% |
8,864 |
8,958 |
| Active Idle |
|
0 |
0 |
JVM 'Node_03.029' Scores:
| Target Load |
Actual Load |
ssj_ops |
| Target |
Actual |
| Calibration 1 |
|
|
84,345 |
| Calibration 2 |
|
|
88,598 |
| Calibration 3 |
|
|
87,930 |
| Calibration 4 |
|
|
88,678 |
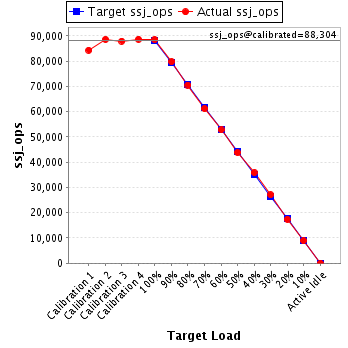
| ssj_ops@calibrated=88,304 |
| 100% |
100.2% |
88,304 |
88,513 |
| 90% |
90.3% |
79,474 |
79,765 |
| 80% |
79.9% |
70,643 |
70,537 |
| 70% |
69.3% |
61,813 |
61,174 |
| 60% |
59.8% |
52,982 |
52,810 |
| 50% |
49.7% |
44,152 |
43,851 |
| 40% |
40.6% |
35,322 |
35,876 |
| 30% |
30.6% |
26,491 |
27,040 |
| 20% |
19.7% |
17,661 |
17,425 |
| 10% |
10.1% |
8,830 |
8,941 |
| Active Idle |
|
0 |
0 |
JVM 'Node_03.030' Scores:
| Target Load |
Actual Load |
ssj_ops |
| Target |
Actual |
| Calibration 1 |
|
|
85,052 |
| Calibration 2 |
|
|
89,553 |
| Calibration 3 |
|
|
89,710 |
| Calibration 4 |
|
|
89,960 |
| ssj_ops@calibrated=89,835 |
| 100% |
99.6% |
89,835 |
89,474 |
| 90% |
89.1% |
80,851 |
80,045 |
| 80% |
81.0% |
71,868 |
72,809 |
| 70% |
69.2% |
62,884 |
62,194 |
| 60% |
60.5% |
53,901 |
54,320 |
| 50% |
50.4% |
44,917 |
45,321 |
| 40% |
39.4% |
35,934 |
35,378 |
| 30% |
29.9% |
26,950 |
26,872 |
| 20% |
19.9% |
17,967 |
17,875 |
| 10% |
9.7% |
8,983 |
8,754 |
| Active Idle |
|
0 |
0 |
JVM 'Node_03.031' Scores:
| Target Load |
Actual Load |
ssj_ops |
| Target |
Actual |
| Calibration 1 |
|
|
85,328 |
| Calibration 2 |
|
|
89,397 |
| Calibration 3 |
|
|
90,163 |
| Calibration 4 |
|
|
90,867 |
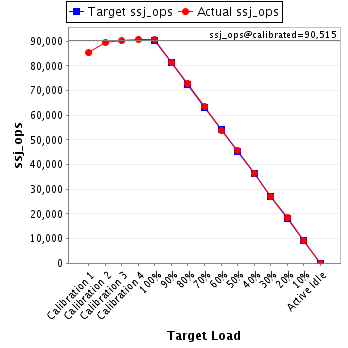
| ssj_ops@calibrated=90,515 |
| 100% |
100.1% |
90,515 |
90,594 |
| 90% |
89.8% |
81,464 |
81,320 |
| 80% |
80.6% |
72,412 |
72,951 |
| 70% |
70.1% |
63,361 |
63,493 |
| 60% |
59.4% |
54,309 |
53,801 |
| 50% |
50.6% |
45,258 |
45,826 |
| 40% |
40.3% |
36,206 |
36,497 |
| 30% |
29.8% |
27,155 |
26,937 |
| 20% |
20.3% |
18,103 |
18,368 |
| 10% |
10.0% |
9,052 |
9,083 |
| Active Idle |
|
0 |
0 |
JVM 'Node_03.032' Scores:
| Target Load |
Actual Load |
ssj_ops |
| Target |
Actual |
| Calibration 1 |
|
|
85,899 |
| Calibration 2 |
|
|
90,951 |
| Calibration 3 |
|
|
90,528 |
| Calibration 4 |
|
|
90,487 |
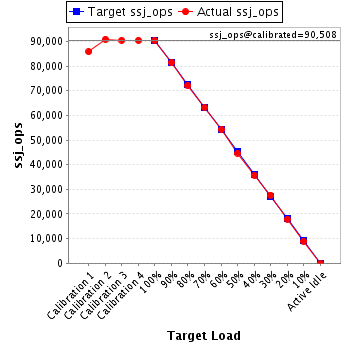
| ssj_ops@calibrated=90,508 |
| 100% |
99.9% |
90,508 |
90,372 |
| 90% |
90.0% |
81,457 |
81,492 |
| 80% |
79.6% |
72,406 |
72,024 |
| 70% |
69.9% |
63,355 |
63,232 |
| 60% |
59.9% |
54,305 |
54,248 |
| 50% |
49.4% |
45,254 |
44,744 |
| 40% |
39.5% |
36,203 |
35,770 |
| 30% |
30.6% |
27,152 |
27,677 |
| 20% |
19.8% |
18,102 |
17,879 |
| 10% |
9.9% |
9,051 |
8,996 |
| Active Idle |
|
0 |
0 |
JVM 'Node_03.033' Scores:
| Target Load |
Actual Load |
ssj_ops |
| Target |
Actual |
| Calibration 1 |
|
|
83,946 |
| Calibration 2 |
|
|
88,940 |
| Calibration 3 |
|
|
89,025 |
| Calibration 4 |
|
|
89,186 |
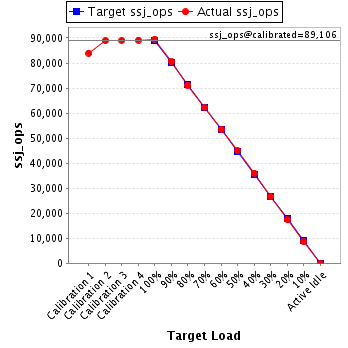
| ssj_ops@calibrated=89,106 |
| 100% |
100.5% |
89,106 |
89,521 |
| 90% |
90.4% |
80,195 |
80,555 |
| 80% |
79.9% |
71,285 |
71,180 |
| 70% |
69.8% |
62,374 |
62,214 |
| 60% |
60.1% |
53,464 |
53,526 |
| 50% |
50.4% |
44,553 |
44,931 |
| 40% |
40.3% |
35,642 |
35,914 |
| 30% |
29.9% |
26,732 |
26,687 |
| 20% |
19.6% |
17,821 |
17,438 |
| 10% |
9.7% |
8,911 |
8,666 |
| Active Idle |
|
0 |
0 |
JVM 'Node_03.034' Scores:
| Target Load |
Actual Load |
ssj_ops |
| Target |
Actual |
| Calibration 1 |
|
|
83,950 |
| Calibration 2 |
|
|
89,283 |
| Calibration 3 |
|
|
89,597 |
| Calibration 4 |
|
|
89,339 |
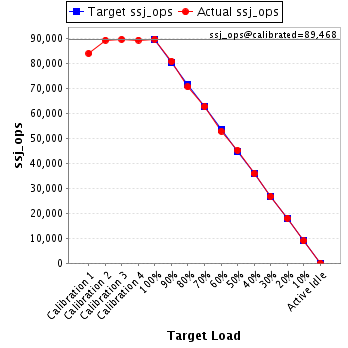
| ssj_ops@calibrated=89,468 |
| 100% |
100.2% |
89,468 |
89,683 |
| 90% |
90.4% |
80,521 |
80,842 |
| 80% |
78.9% |
71,574 |
70,619 |
| 70% |
70.1% |
62,628 |
62,684 |
| 60% |
59.1% |
53,681 |
52,845 |
| 50% |
50.5% |
44,734 |
45,190 |
| 40% |
40.1% |
35,787 |
35,859 |
| 30% |
29.9% |
26,840 |
26,745 |
| 20% |
20.2% |
17,894 |
18,077 |
| 10% |
10.0% |
8,947 |
8,929 |
| Active Idle |
|
0 |
0 |
JVM 'Node_03.035' Scores:
| Target Load |
Actual Load |
ssj_ops |
| Target |
Actual |
| Calibration 1 |
|
|
85,288 |
| Calibration 2 |
|
|
90,119 |
| Calibration 3 |
|
|
91,055 |
| Calibration 4 |
|
|
90,917 |
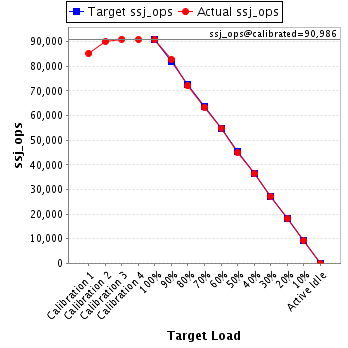
| ssj_ops@calibrated=90,986 |
| 100% |
99.7% |
90,986 |
90,756 |
| 90% |
90.9% |
81,887 |
82,727 |
| 80% |
79.2% |
72,789 |
72,103 |
| 70% |
69.7% |
63,690 |
63,430 |
| 60% |
60.3% |
54,591 |
54,907 |
| 50% |
49.5% |
45,493 |
44,996 |
| 40% |
40.0% |
36,394 |
36,356 |
| 30% |
29.9% |
27,296 |
27,201 |
| 20% |
20.0% |
18,197 |
18,161 |
| 10% |
10.1% |
9,099 |
9,150 |
| Active Idle |
|
0 |
0 |
JVM 'Node_03.036' Scores:
| Target Load |
Actual Load |
ssj_ops |
| Target |
Actual |
| Calibration 1 |
|
|
85,548 |
| Calibration 2 |
|
|
91,250 |
| Calibration 3 |
|
|
90,975 |
| Calibration 4 |
|
|
90,726 |
| ssj_ops@calibrated=90,851 |
| 100% |
99.8% |
90,851 |
90,655 |
| 90% |
89.0% |
81,766 |
80,860 |
| 80% |
79.9% |
72,681 |
72,553 |
| 70% |
70.7% |
63,595 |
64,255 |
| 60% |
60.6% |
54,510 |
55,096 |
| 50% |
50.0% |
45,425 |
45,445 |
| 40% |
40.2% |
36,340 |
36,510 |
| 30% |
30.3% |
27,255 |
27,496 |
| 20% |
20.1% |
18,170 |
18,304 |
| 10% |
9.8% |
9,085 |
8,896 |
| Active Idle |
|
0 |
0 |